
Off-Puck Scoring Opportunities
This project was selected as a finalist for the inaugural Hockey Analytics & League Operations (HALO) Hackathon 2026. This post describes the content of the presentation, which you can view in full below, with the accompanying slides available here. The full report, with all technical details and methodology, is available here.
Space, and how to value it
Over the course of an ice hockey game, any given player is actually in control of the puck for very little time compared to their overall time on ice. We can learn a lot about a player’s abilities by examining their off-puck behaviour. Off-puck movement is all about space, and how you interact with it. We could view three key goals of a hockey player as occupying dangerous spaces, creating space for their teammates, and suppressing it for their opponents.
To analyse this, we need a notion of value for space on the ice. We can break down the value of a space into 3 components:
- Availability: how likely is it that the puck is passed to a space, given the location of the puck carrier and defenders?
- Control: if the puck is passed to a space, how likely is it that the offensive team retains control?
- Danger: if a shot is taken from this space, how likely is it to result in a goal?
With these quantities defined, we define the off-puck scoring opportunity (OPSO), at any given location on the ice, as the probability of:
- A pass being attempted to that location (availability).
- The pass being successfully controlled by the offensive team (control).
- The ensuing shot resulting in a goal (danger).
This definition may seem overly specific, however, it has some very useful consequences. Firstly, it allows us to write
\[\textrm{OPSO} = \textrm{Danger} \times \textrm{Control} \times \textrm{Availability},\]by a simple application of the law of total probability (see the full report appendix A for details). Secondly, this definition isolates the threat posed by the movement of the off-puck offensive players. This differs from a traditional expected threat (xT) model, which also considers alternative actions from the puck carrier, such as a carry or a direct shot. Restricting potential actions to passes, as this definition does, allows us specifically to quantify the value of the positions of the off-puck players.
In this way, OPSO quantifies offensive threat posed by off-puck players in each location, and we can summarise the overall threat at any given time by summing across the ice surface. This framework was first introduced for soccer by William Spearman in 2018 at MIT Sloan, extending on his initial ideas of pitch control.
Since we can break OPSO down into 3 individual components, we can train separate models for availability, control, and danger, and then combine them to obtain a full OPSO model.
Three Models
For simplicity, we restrict our attention to 5v5 situations. An interesting future area of research could be to train these models on powerplay situations, where space becomes even more important.
Availability Model
Given any on-ice state, the availability model aims to predict which locations (and hence players) are most likely receive a pass from the puck carrier. This is a very complex problem, so we make the simplifying assumption used by Inayatali and Chan that the probability of a pass being attempted to a given location is proportional to its probability of success. Although this assumption may not hold in practice, it provides a reasonable approximation of passing behaviour. Any accuracy lost through making the assumption is mitigated by improved performance on the simplified modelling question.
With this assumption made, our problem reduces to a pass success probability model. Given the location of all players on the ice and the puck, what is the probability that a pass to a given location is successful? There are many possible approaches to this problem, such as logistic regression or even a neural network, but I chose an XGBoost binary classifier, which is well-suited to handling the spatial nature of the problem, whilst being lightweight to train and tune.
With spatial models such as these, feature engineering is crucial. The following features were used as inputs:
- Distance to target
- x (forward/backward) and y (cross-ice) distance to target
- For each of the (up to) 3 closest defenders to the passer:
- Defender distance to passer
- Defender distance to target
- Angle of defender to the intended pass lane
The model was trained on over 200,000 even-strength passes, and obtained a cross-validated ROC AUC of 0.75. A major flaw is that for the failed passes, we only have data on the location of the interception, not the intended pass target. Not all interceptions occur close to the intended target, so this will definitely distort the model’s predictions. As consolation, we fall back on the famous adage that the model is wrong, but it is still useful.
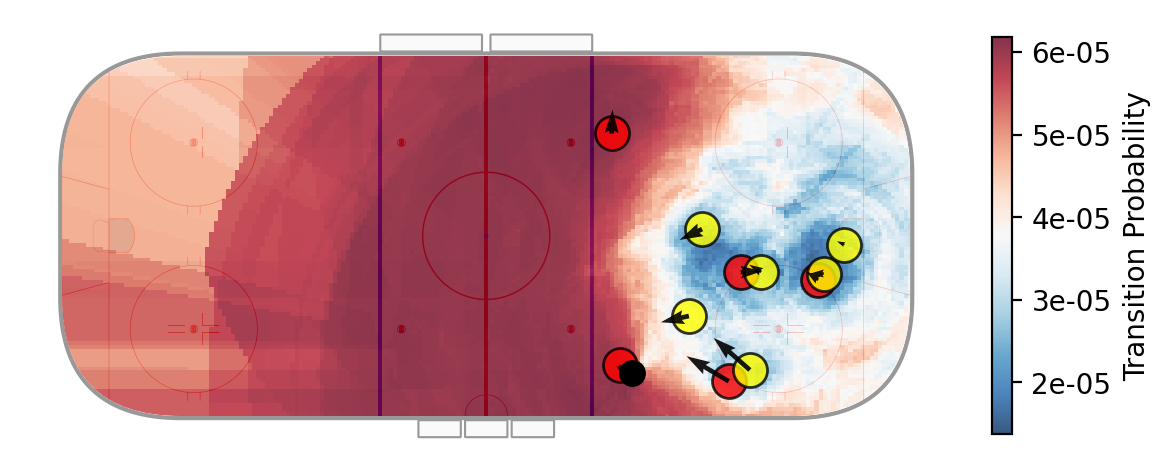
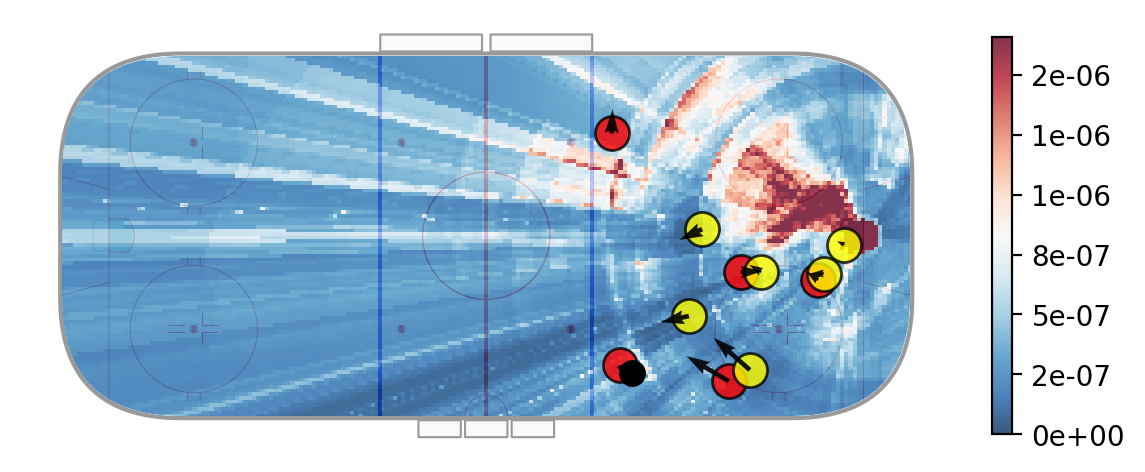
An example transition probability heatmap, generated from the outputs of the model on a 200x100 grid, is shown below. Encouragingly, this heatmap matches our intuition quite well. The most likely pass would be along the blue line to the puck-carrier’s defense partner, as all other teammates are well-covered by the defense.
Control Model
For each location on the ice, the control model needs to learn how likely the offensive team is to control the puck, if a pass is made to that location. For example, a player with no surrounding defenders is likely to successfully control an incoming pass, and has high control over the space around them. In contrast, if a player is in tight coverage, the winner of the puck battle is closer to a 50/50 proposition. This concept is closely related to the idea of pitch control in soccer.
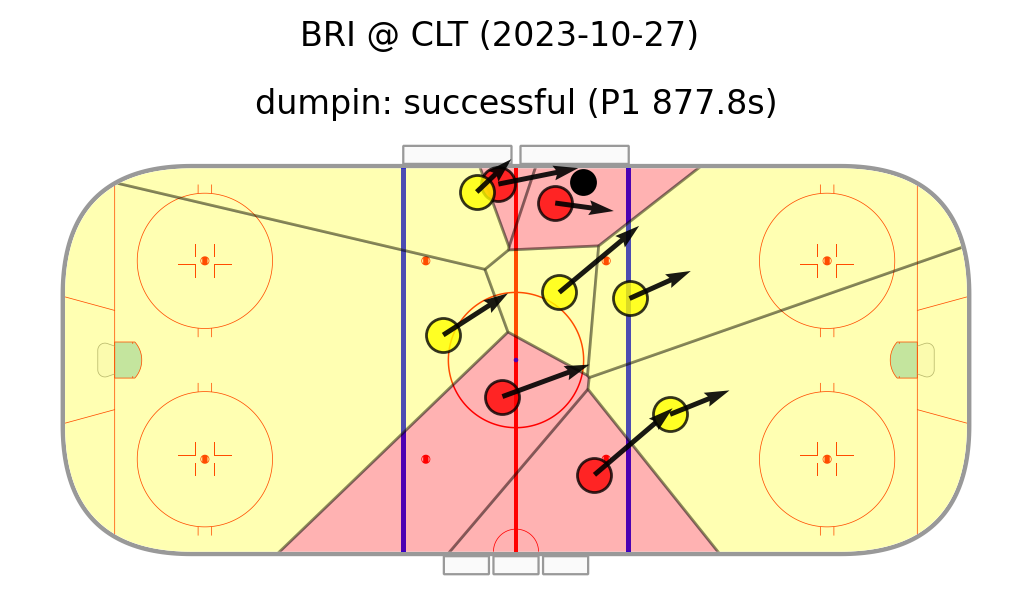
The simplest approach to this problem is through the use of Voronoi diagrams, which assign control of a space completely to the closest player, as shown below. This however, is not a particularly good representation of what is happening on the ice. It ignores the speed and direction of the players, and crucially, does not reflect the inherent randomness of puck battles. A more intuitive approach would be probabilistic.
In the original soccer implementation, a complex physics-based model was developed. This is not possible for us, as we don’t have access to touch-level data. Instead, we turn to a heuristic approach proposed for soccer by Fernandez et al.
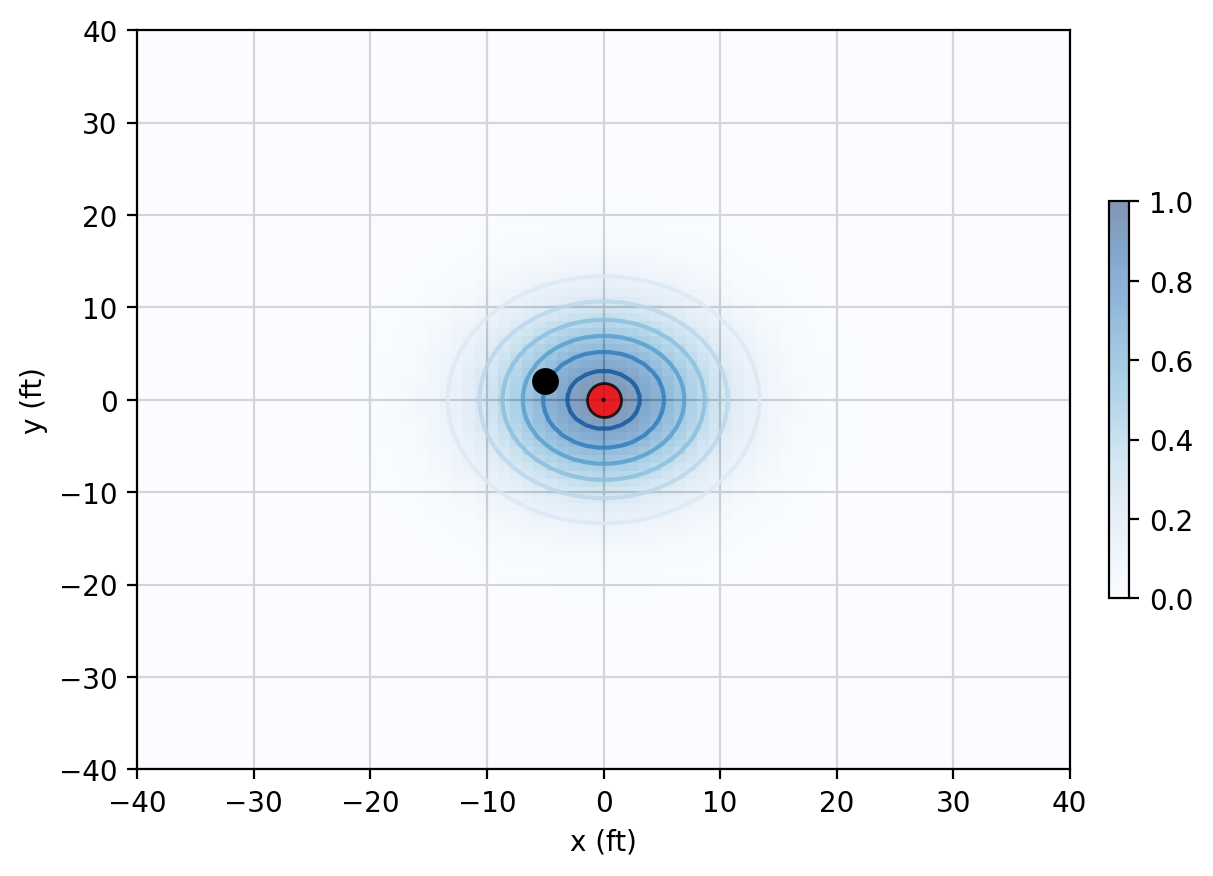
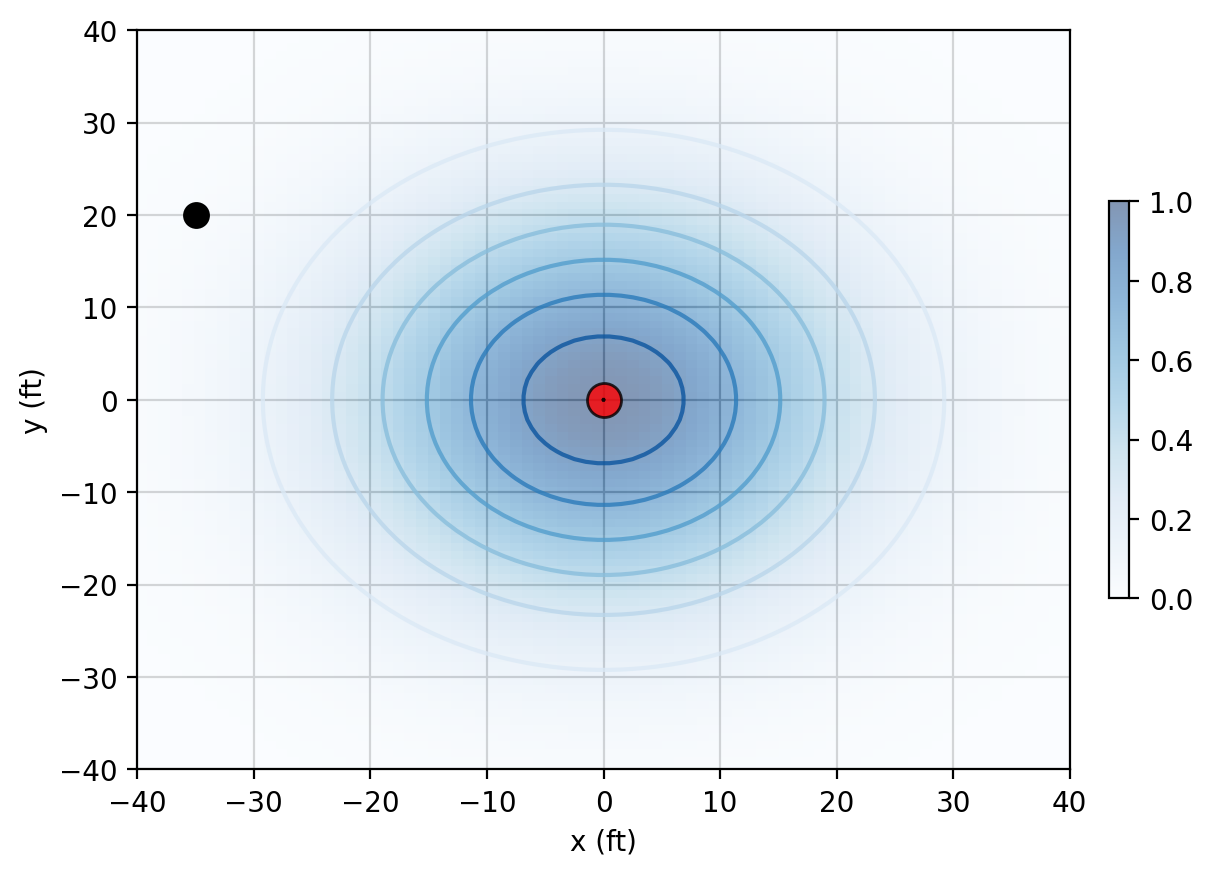
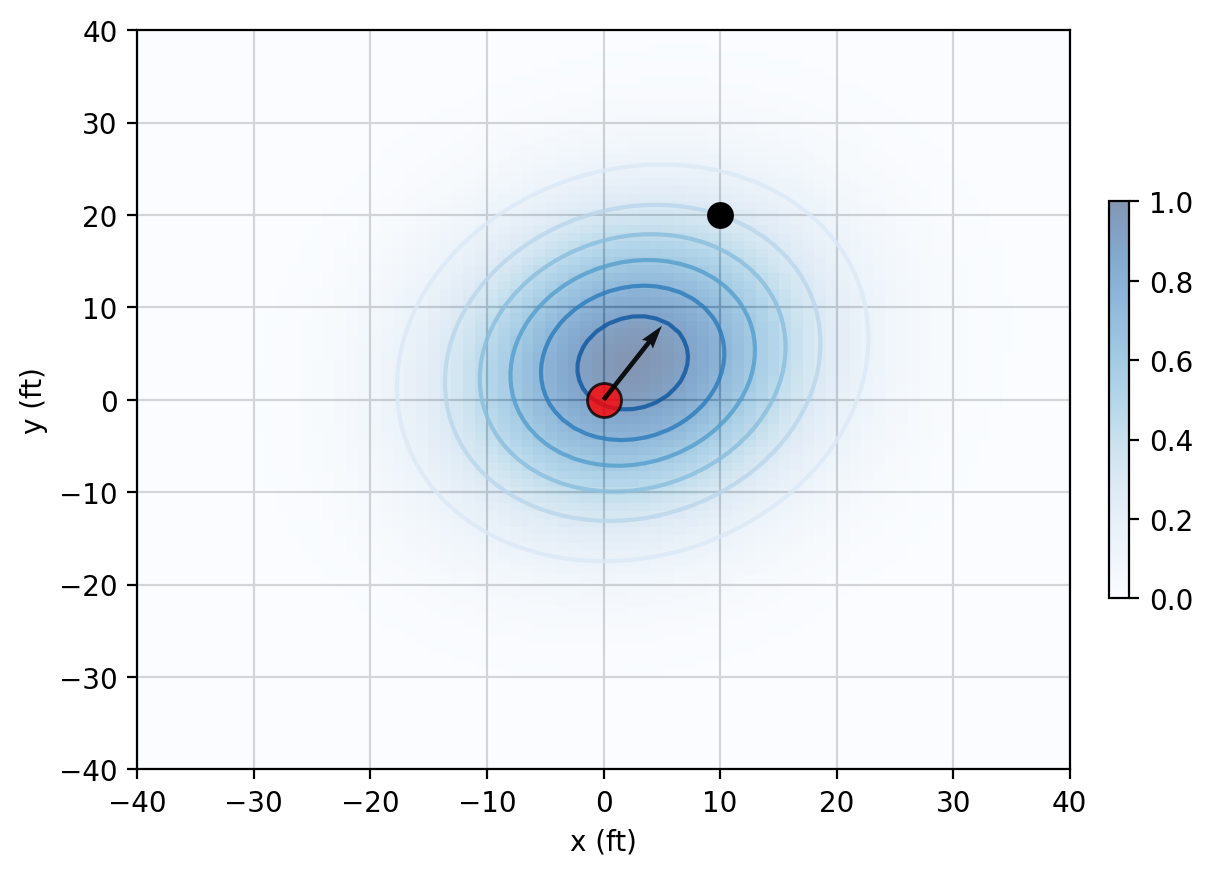
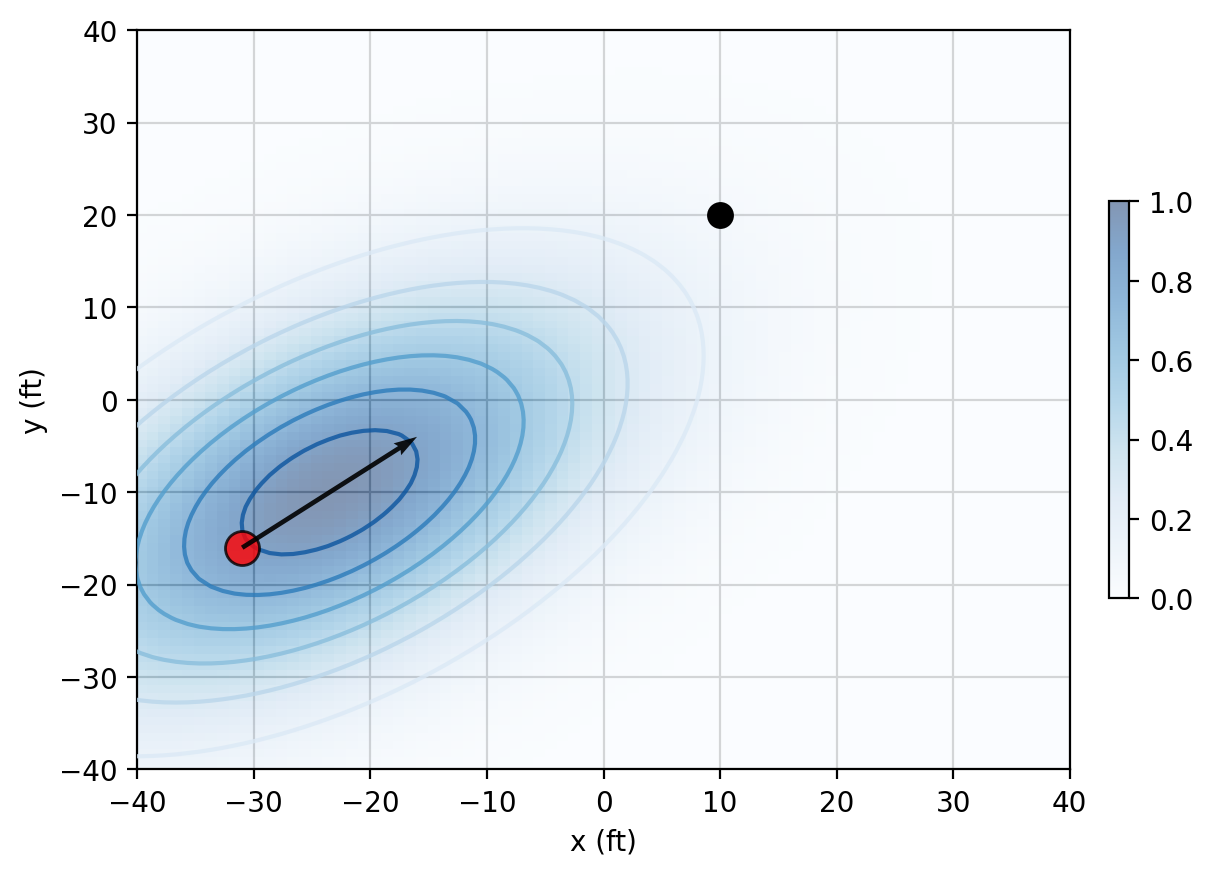
For each player, we define their influence as an ellipse (described by a Gaussian 2D p.d.f.), whose size and shape vary with the player’s speed, direction and distance from the puck. The concepts implemented are:
- The direction of the ellipse aligns with the direction of the player’s movement.
- The faster a player is moving, the narrower (but longer) their ellipse is, to reflect the difficulty of changing direction.
- The further away from the puck a player is, the larger their influence ellipse, to reflect the increased reaction time available.
See the full report appendix A for details on how these quantities affect the influence shape. Some examples are shown below:
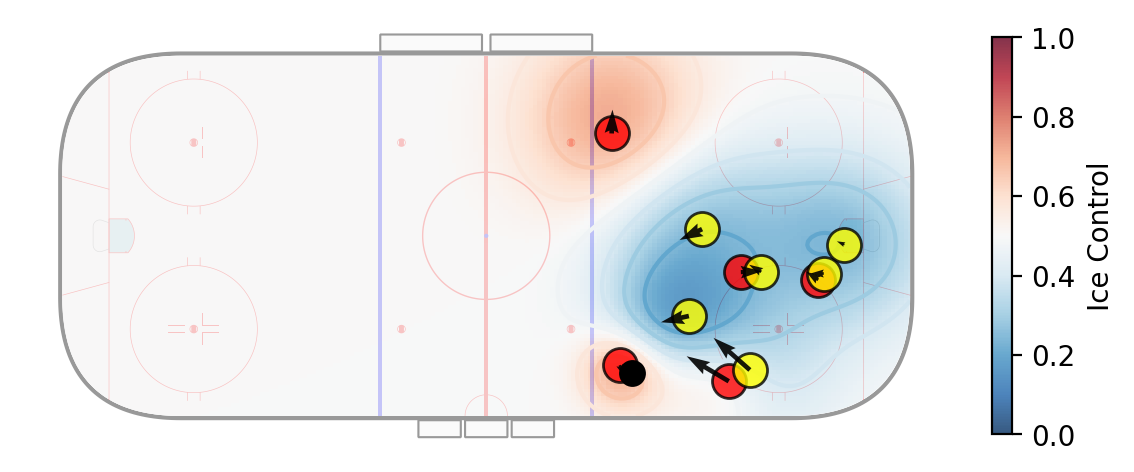
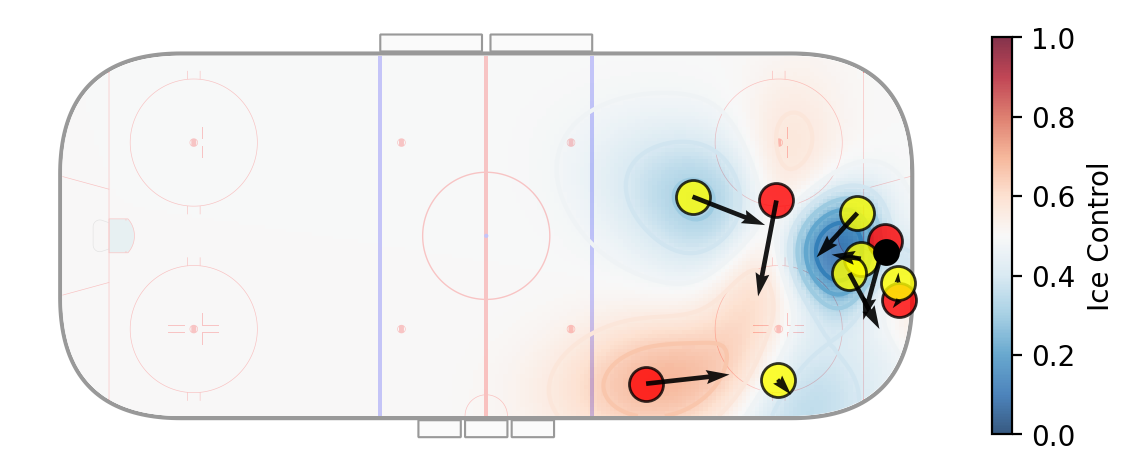
With these set up, we can simply sum up influence for all the players on the ice (positive for offensive players, negative for defenders), and normalise to obtain the control probability (ice control). The probability surface for the same play as before is shown below. Once again, the model reflects our intuition that the 3 forwards are well-covered and do not have particularly good control of their space.
Danger Model
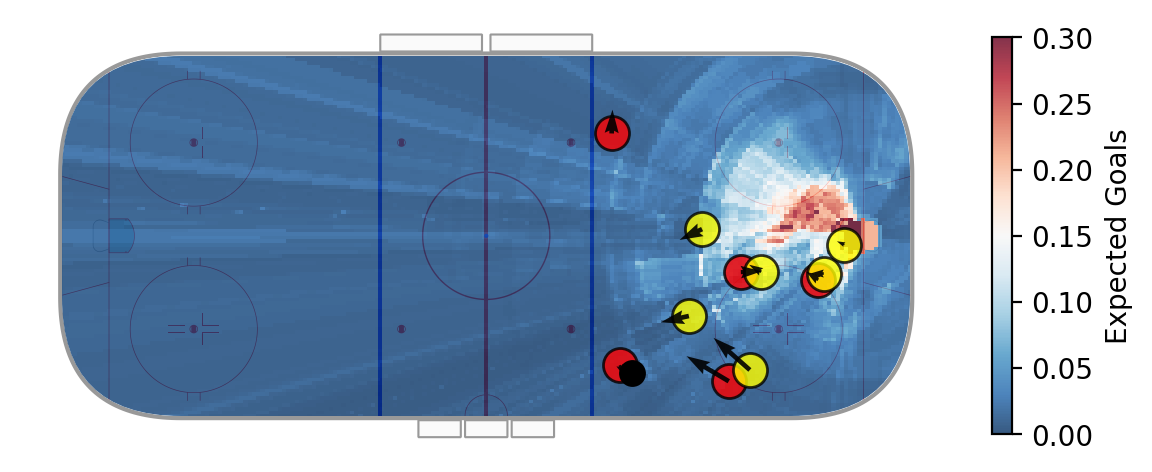
The danger model seeks to learn the probabilty of a goal from a shot from any given location on the ice, so is effectively an expected goals (xG) model. An XGBoost binary classifier is currently the most popular type of model for expected goals, so I use it again here. The model was trained on over 32,000 even-strength shots, obtaining a cross-validated ROC AUC of 0.78, using the following features:
- Angle of shot to goal
- Distance of shot to goal
- For each of the (up to) 2 closest defenders to the intended shot path:
- Defender distance to goal
- Perpendicular distance of the defender to the intended shot path (i.e. 0 implies the defender is blocking the line of the shot to goal)
A key area of improvement here would be to add sequence-based features, such as the trajectory of the hypothetical pass (to account for induced goaltender movement).
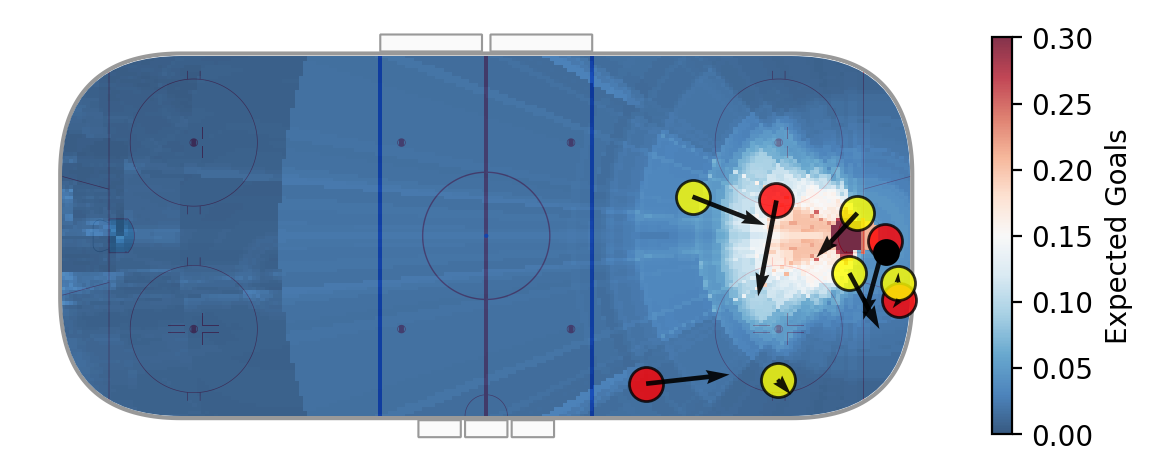
An example xG heatmap is shown below for the same play.
Putting it Together
Now that we have our 3 separate models, we can multiply them together to get the OPSO model. The resulting heatmap, displaying the OPSO (as defined above) at each location, is shown below. When summing across the whole ice surface, we obtain an overall OPSO value of 0.77%, describing the overall scoring threat posed by players off the puck.
Applications: Moving Beyond Shot-Based Metrics
The great benefit of this type of model is that it allows us to analyse hockey plays on the level of events that almost happened. Traditional shot-based metrics, such as xG, Corsi and Fenwick, only recognise plays that result in shots (attempts or on goal). Plays where a pass is intercepted just before it reaches a player in a dangerous position, for example, are unaccounted for, even when they play an important part in telling the story of a game. OPSO is able to recognise such situations where the off-puck players are in very dangerous positions and assign credit, regardless of whether the situation was fully exploited.
Play-by-Play Analysis
In this way, OPSO can be used in a similar way to xG to identify high danger chances (or defensive breakdowns, depending on your perspective), which can be useful for post-game analysis and coaching. One such situation is shown below, where the offensive team has the puck behind the net, and a player is open in the slot, leading to an overall OPSO of 1.08%. The component models have the added benefit that they can be used to isolate exactly how danger is being created.
Player and Team Evaluation
One of the most exciting possibilities with this model is the potential to evaluate the quality of players’ off-puck movements through secondary metrics which quantify how often players occupy high OPSO areas. This could be an exciting way of evaluating the league’s best snipers, who excel at separating themselves from defenders and firing high-quality shots. There is also scope for evaluating on-puck actions; we can look at which players generate the most OPSO for their teammates through their actions with the puck. For example, Connor McDavid often draws in defenders with his carries into the offensive zone, creating space for his teammates; this metric would reward that. Finally, there are exciting possibilities for evaluating positional defensive play, which is typically very hard to do.
Where are these metrics? Are they predictive? Well, unfortunately that hasn’t been done yet. Time for the hackathon was limited, and my current implementations are not very computationally efficient, so this is an area for further research. I hope to have time to work on that this summer!
Conclusion
We have developed a model which quantifies the threat posed by off-puck players. It is far from perfect, however in its current state it provides an insightful tool for analysing in-game events and measuring team performance, with potential for unique player evaluation methods. There is much scope for improvement to the model itself, and the overall structure allows us to improve each underlying model separately, simplifying the problem. The immediate next steps would be improving the danger model, and computing OPSO over the full dataset, allowing us to investigate the player evaluation ideas discussed above.
If you made it this far, thank you for reading! For more detail on any of the topics discussed, I invite you to read the full report, which goes into more depth (particularly in the appendices). If you have further questions, suggestions, or comments, I invite you to reach out via the social links on this page, or by leaving a comment below.